7. The risk of travel


An aircraft accident is defined as an occurrence associated with the operation of an aircraft which takes place between the time any person boards the aircraft with the intention of flight and all such persons have disembarked, and in which any person suffers death or serious injury, or in which the aircraft receives substantial damage.
Transport is a classic case of the public perception of risk being at variance with the actual numbers. The statistics range up and down, particularly in mass transport, where one incident can cause a large number of fatalities.
Another feature of transport risk is that the impact of the numbers is very dependent on how you represent them. Basically, there are three possible ways of quoting transport risk; in terms of distance travelled, number of journeys or time of travel. Interested parties tend to choose the form of presentation that suits their own purposes.
The air transport industry, for example, will almost always choose a per km basis, which is optimum for them, as most fatalities occur on landing and take-off, while the distances are large. Land based transport organisations, in contrast, will tend to select fatalities per number of journeys or hours of travel, since the risks are uniformly spread. Thus both are able to demonstrate that theirs is the safest form of transport. The actual statistics are given below (taken from an article by Roger Ford in Modern Railways, Oct 2000 and based on a DETR survey). They record the number of fatalities per billion km, journeys or hours of travel.
|
km |
journeys |
hours |
|
Air 0.05 |
Bus 4.3 |
Bus 11.1 |
|
Bus 0.4 |
Rail 20 |
Rail 30 |
|
Rail 0.6 |
Van 20 |
Air 30.8 |
|
Van 1.2 |
Car 40 |
Water 50 |
|
Water 2.6 |
Foot 40 |
Van 60 |
|
Car 3.1 |
Water 90 |
Car 130 |
|
Pedal cycle 44.6 |
Air 117 |
Foot 220 |
|
Foot 54.2 |
Pedal cycle 170 |
Pedal cycle 550 |
|
Motorcycle 108.9 |
Motorcycle 1,640 |
Motorcycle 4,840 |
The one thing that stands out is that, whichever way you look at it, motorcycles are disastrously the most dangerous form of transport.
Bus and rail are the safest form of transport by any measure, while road traffic injuries represent the leading cause in worldwide injury-related deaths, their popularity undermines this statistic.
Airplane accident causes:
- air traffic control error
- bird strike
- cargo hold/cabin fire
- design flaw
- sabotage/explosive device
- fuel starvation
- hijacking (resulting in fatalities)
- lightning
- pilot incapacitation
- pilots shot by passengers
The number of accidents per flight decreases with time. But the number of fatalities per year is changing and does not decrease.
Nowadays, aircraft accidents are less likely than 20 years ago. Nevertheless, the growing number of flying aircraft and their increasing capacity cannot result in a reduction of onboard fatalitie.
7.1 Statistics
The table above is compiled from the PlaneCrashInfo.com accident database and represents 1,300 fatal accidents involving commercial aircraft, world-wide, from 1950 thru 2008 for which a specific cause is known. Aircraft with 10 or less people aboard, military aircraft, private aircraft and helicopters are not included.
"Pilot error (weather related)" represents accidents in which pilot error was the cause but brought about by weather related phenomena. "Pilot error (mechanical related)" represents accidents in which pilot error was the cause but brought about by some type of mechanical failure. "Other human error" includes air traffic controller errors, improper loading of aircraft, fuel contamination and improper maintenance procedures. Sabotage includes explosive devices, shoot downs and hijackings. "Total pilot error" is the total of all three types of pilot error (in red).
|
Cause |
1950s |
1960s |
1970s |
1980s |
1990s |
2000s |
All |
|
Pilot Error |
40 |
32 |
24 |
25 |
27 |
25 |
29 |
|
Pilot Error (weather related) |
11 |
18 |
14 |
17 |
21 |
17 |
16 |
|
Pilot Error (mechanical related) |
7 |
5 |
4 |
2 |
4 |
3 |
4 |
|
Total Pilot Error |
58 |
57 |
42 |
44 |
53 |
45 |
50 |
|
Other Human Error |
0 |
8 |
9 |
6 |
8 |
9 |
7 |
|
Weather |
16 |
10 |
13 |
15 |
9 |
8 |
12 |
|
Mechanical Failure |
21 |
20 |
23 |
21 |
21 |
28 |
22 |
|
Sabotage |
5 |
5 |
11 |
13 |
10 |
9 |
9 |
|
Other Cause |
0 |
2 |
2 |
1 |
0 |
1 |
1 |
Where there were multiple causes, the most prominent cause was used. Source: PlaneCrashInfo.com database.
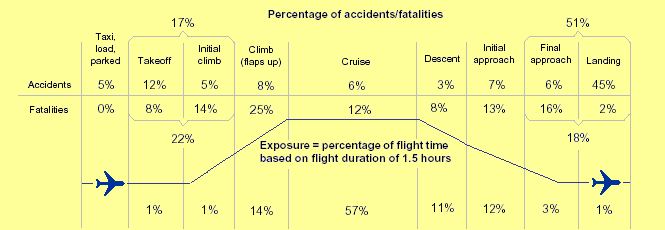
Accidents and Fatalities by Phase of Flight: Source: Statistical Summary of Commercial Jet Airplane Accidents, Boeing.
Which type of flying is safer?
|
Type of Flight |
Fatalities per million flight hours |
|
Airliner (Scheduled and non-scheduled) |
4.03 |
|
Commuter Airline (Scheduled ) |
10.74 |
|
Commuter Plane (Non-scheduled - Air taxi on demand) |
12.24 |
|
General Aviation (Private) |
22.43 |
Sources: NTSB Accidents and Accident Rates by NTSB Classification 1998-2007.
Odds of being involved in a fatal accident
| Odds of being on an airline flight which results in at least one fatality |
Odds of being killed on a single airline flight |
|
Top 25 airlines with the best records |
Top 25 airlines with the best records |
|
Bottom 25 with the worst records |
Bottom 25 with the worst records |
Source: OAG Aviation & PlaneCrashInfo.com accident database, 1989 – 2008.
Survival rate of passengers on aircraft involved in fatal accidents carrying 10+ passengers
|
% surviving |
|
|
1930s |
21 |
|
1940s |
20 |
|
1950s |
24 |
|
1960s |
19 |
|
1970s |
25 |
|
1980s |
34 |
|
1990s |
35 |
|
2000s |
24 |
Source: PlaneCrashInfo.com accident database.
Survival rate of passengers on aircraft ditching during controlled flight
|
Survival rate of passengers on aircraft ditching during controlled flight |
53% |
For the following graphs we used lists of accidents and incidents involving commercial air transport accidents, road (bus) accidents and rail accidents, grouped by the years in which the accidents and incidents occurred.


The first graph represents the casualties of commercial air transport accidents (2000–2009) in the world, the second represents the casualties of notable road (bus) accidents (2000–2009) in the world and the third represents the casualties of notable rail accidents (2000–present) in the world
Regarding the road transportation there are much more variables when dealing with road accidents, as it involves cars, drivers, objects, pedestrians, meteorological changes and lots of other factors.
Rail transport is the safest form of land travel. Trains can travel at very high speed, but they are heavy, are unable to deviate from the track and require a great distance to stop. Possible accidents include derailment (jumping the track), a head-on collision with another train and collision with an automobile or other vehicle at a level crossing. The most important safety measures are railway signalling and gates at level crossings. Train whistles warn of the presence of a train, while trackside signals maintain the distances between trains. Vandalism and negligence is responsible for many accidents.
The last two graphs, below represent a comparison between the three means of transportation.

