Session 7: Measuring the noise level and the noise spectrum of a noise generator (speaker )


Objective1: understanding what is a decibel scale dB, understanding how varies the noise level
for different decibel scales;
Objective 2: understanding what is the white noise; what is a bandwidth
Objective 3: what is the noise level and the noise spectrum, pick values and mediate values
Explanation:
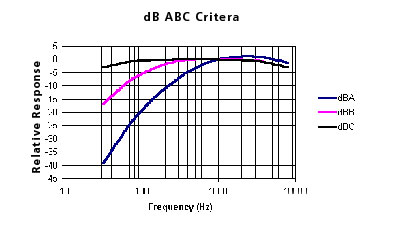
The noise is measured with a decibel scale dB. There are many different scales (the most important are dB A and dB C) that correlate the measured sound response to the human sense of sound. The most used filter is A, filters B and C are rarely used. Measurements made with this scales are expressed as dB (A), dB (B), dB (C).
For generating the signal, you will use a computer (any computer that has a sound card). From the computer the signal goes to an amplifier and then to a speaker. For the signal generation you can use files already generated (mp3 or wav )
While the signal is generated the data acquisition will also be done. You will use the spectrometer to read the signal. You will also visualize the signal on the spectrometer’s display
Material:
- computer
- noise generator (speaker)
- sound level meter
Maximum duration:
60 minutes
Main questions to be asked:
- What differences do they observe in the spectrum of frequencies, when they use dB(A) and
- dB(C) filters in comparison to the situation they do not use any filter?
- How vary the noise level for different decibel scales? dB(A) and dB(C)
- How vary the values when they are measured as pick values and as mediate values?
- What frequencies incorporate the white noise?
- What is a bandwidth?
- Which sound is more disturbing? The wide band or narrow band sound?
Introduction/Starters
- Play a CD containing all sort of noises; noises created by different types of transportation, electronic devices, animals, etc. Try to match them: which sound corresponds to which type of transportation, electronic devices, animals etc...
- a poster with the decibel scale and explain them the scale
OR
- play some movies that we recorded using the noise acquisition system and an aeromodel, a car etc as a noise generator.
Main activities
1. Turn on the noise generator (in this case the noise generator is assembly consisting of the computer, the amplifier and the speaker) and the sound level meter.
Turn on the white noise wav file.
The noise generator will generatea signal containing all the frequencies (this is the white noise).
Ask the students to measure the noise spectrum and the sound level using the sound level meter.
The noise spectrum is represented by the sound level on every frequency.
This measurements are done for observing the dominate frequencies.
Ask them to measure the spectrum on the dB A scale and on the dB C scale (observe the differences); this first measurement is for the pick values. The graph they will observe on the display is similar to the one below. Ask them to write the values of the noise level for the frequencies in the table below and then to draw a graph.
2. For the second measurement, they will measure the mediate value of the noise spectrum, also on the dB A scale and on the dB C scale (observe the differences); the mediate value of the spectrum is done in a period of time (few seconds) – set the period of time on the sound level meter. The graph they will obtain on the display of the sound level meter for both measurements is called histogram. Also ask them to make the same table using the mediate values and draw a graph.
The total noise level is the sum of all the noise level on all the frequencies (one single value). This measurement of the noise level can be done on the dB A scale and on the dB C (observe the differences); They will first measure the total noise level – the pick value and setting a period of time they will measure the mediate value of the total noise level.
It will be generated different frequencies (play the different wav files): 50Hz, 100Hz, 125Hz, 200Hz, 500 Hz, 1000Hz, 2000Hz, 4000 Hz, and 6300 Hz, 12500 Hz, 16000 Hz and the, measurements above are repeated. Ask the students to use the table below to write down the results and draw a graph.
It will be generated a base frequency (1000 Hz) (with a wav file) and the bandwidth is modify;
Using the sound level meter, they will visualize the frequencies spectrum and the loudness.
Conclusion / Plenary
- What differences do they observe in the spectrum of frequencies, when they use dB(A) and dB(C) filters?
If you use dB (A), there are certain frequencies that are attenuated compared to the use of dB(C) - How vary the noise level for different decibel scales? dB(A) ,and dB(C)